Research and Development in Hong Kong: What can our government do to make Hong Kong competitive?
Figure 1Comparing the Gross Domestic Product (GDP) per capita (in current US$) of Hong Kong with US, Singapore and Mainland China over the past 50 years. Source: World Bank
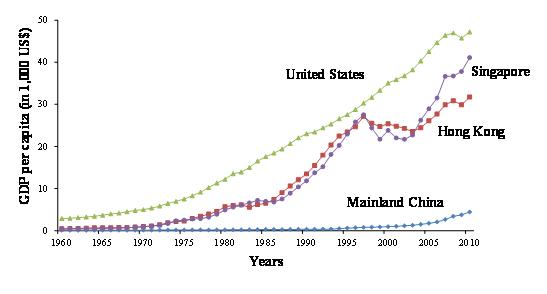
Figure 2Total expenditure on R&D as a percentage of GDP in 2009. Source: World Competitiveness Yearbook, 2012
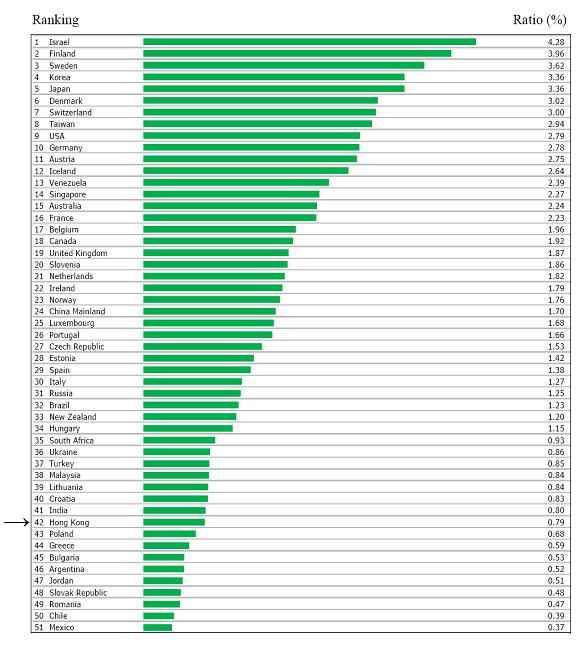
Figure 3GERD (as a percentage of GDP) of Four Asian Dragons and Mainland China. Sources: World Competitiveness Yearbook 2012, OECD Main Science and Technology Indicators datasets, Hong Kong Innovation Activities Statistics and 2010年全国科技经费投入统计公报
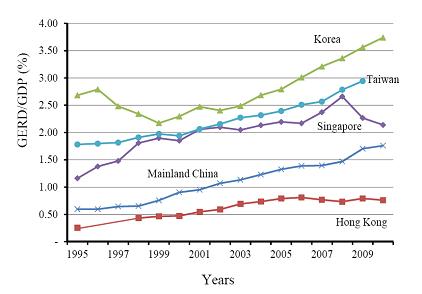
Figure 4Comparison of per capita GERD (in US$) between Hong Kong and Singapore over recent years. Sources: World Bank, website of Census and Statistics Department of HKSAR (Science and Technology), National Survey of Research and Development in Singapore 2010
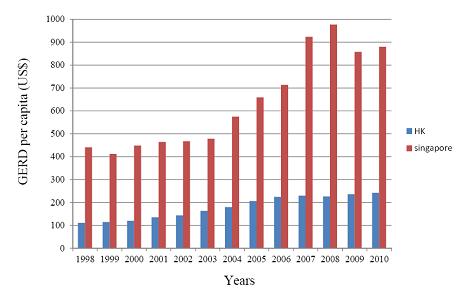
Figure 5 Yearly trends of R&D expenditures by public and private sectors in Singapore (SGP) and Hong Kong (HK). Sources: Hong Kong Innovation Activities Statistics 2008-2010, OECD Main Science and Technology Indicators datasets, National Survey of Research and Development in Singapore 2010
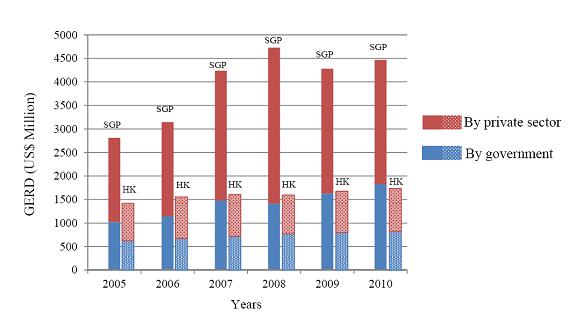
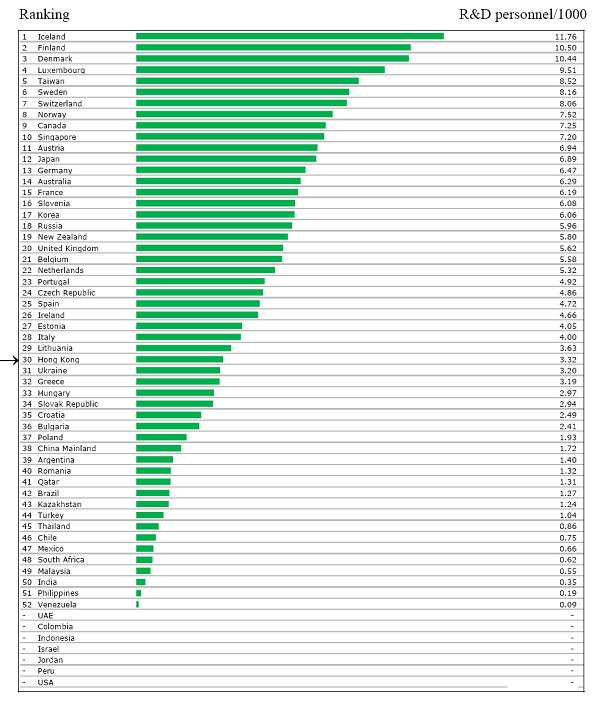
Figure 6Total R&D personnel per 1000 population in 2009. Source: World Competitiveness Yearbook, 2012